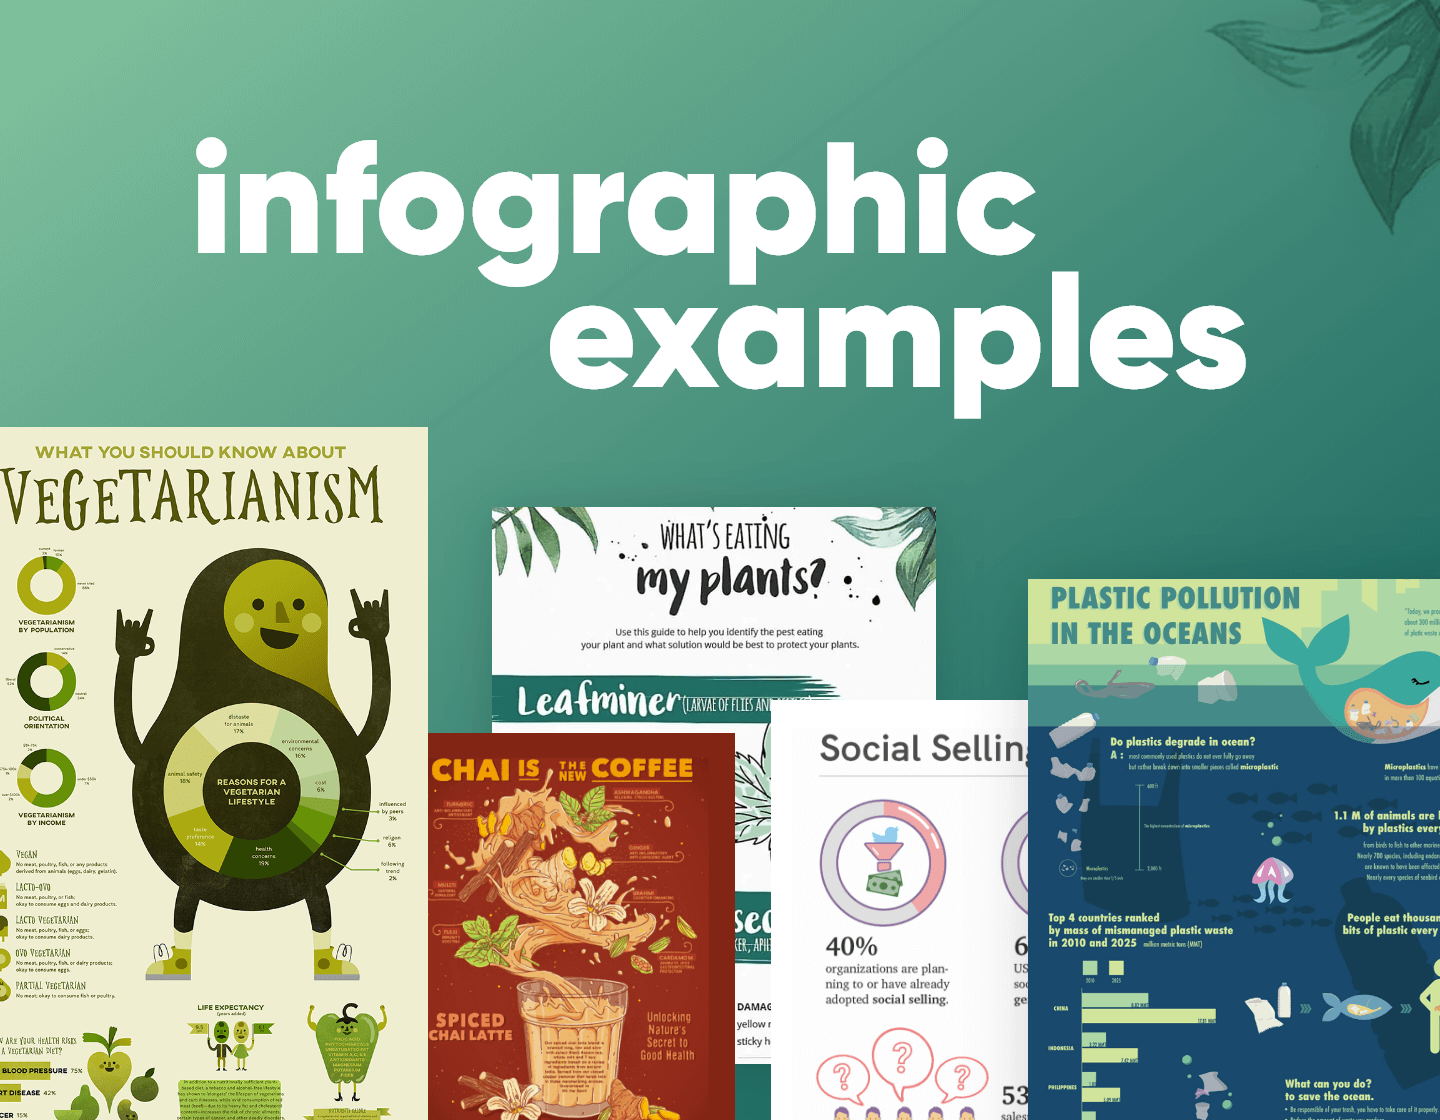
Infogram is an online tool that allows users to create and share visual content such as charts, graphs, and infographics. With its intuitive interface and extensive library of templates and design elements, Infogram has become a popular choice for businesses, educators, and individuals looking to present complex data in a more engaging and accessible way.
Infogram was founded in 2012 by Uldis Leiterts and Raimonds Kaze, both of whom had backgrounds in digital marketing and design. Their goal was to create a tool that would make it easier for anyone to create compelling visual content without the need for specialized design skills or software.
Since then, Infogram has grown to become a leading provider of data visualization tools, serving millions of users in over 190 countries. Its platform is used by organizations such as The Economist, National Geographic, and the United Nations, as well as by small businesses, non-profits, and educators.
One of the key features of Infogram is its extensive library of pre-designed templates and themes. These templates cover a wide range of topics and data types, from financial reports and marketing analytics to social media metrics and scientific research. Users can also customize these templates with their own branding, colors, and fonts, or create their own designs from scratch.
Infogram’s drag-and-drop interface makes it easy to add data to your visuals, whether you’re uploading a spreadsheet, linking to a data source, or manually inputting data. The platform supports a variety of data formats, including CSV, XLSX, Google Sheets, and JSON. You can also use Infogram’s built-in data editor to clean, filter, and transform your data before presenting it in your visual.
Another advantage of Infogram is its ability to create interactive content. Users can add animations, hover effects, and clickable elements to their visuals, allowing viewers to explore the data in greater detail. Infogram also offers real-time data updating, so you can keep your visuals up-to-date with the latest information.
Infogram’s pricing plans range from free to enterprise-level, with each plan offering different features and capabilities. The free plan allows users to create up to 10 projects with basic features, while the pro plan ($19/month) offers unlimited projects with advanced features such as custom branding and analytics. The team and enterprise plans offer additional features such as shared libraries, user roles and permissions, and dedicated support.
Overall, Infogram is a powerful tool for anyone looking to create compelling visual content. Its intuitive interface, extensive library of templates, and support for various data formats make it a popular choice for businesses, educators, and individuals alike. Whether you’re looking to create a simple chart or a complex infographic, Infogram has the tools you need to get inspired and start visualizing your data.


