

What Are Business Intelligence Exercises?
You use business intelligence exercises to practice working with data. These tasks mimic real work in companies. They involve collecting info, cleaning it, and creating visuals. Think of them as workouts for your brain—they strengthen your data muscles.
Companies rely on BI to make quick decisions. For example, a store might use BI to track sales drops. Exercises teach you how to do that. They cover tools like spreadsheets and advanced software. Practice builds speed and accuracy in handling data.
Why Practice Business Intelligence Exercises?
You gain many perks from doing business intelligence exercises. They sharpen your skills for the job market. Here’s a breakdown:
- Improve Decision-Making: You learn to spot patterns fast. This helps businesses choose the right path.
- Boost Efficiency: Clean data quicker and automate reports. Save time on daily tasks.
- Gain Competitive Edge: Data-driven firms acquire customers 23 times faster, per stats from 2024-2026 BI adoption reports.
- Enhance Insights: Turn numbers into stories. Share findings with teams easily.
- Reduce Risks: Predict issues before they hit. Avoid costly mistakes.
Regular practice makes complex data feel simple. You become a go-to expert in your field.
Key Statistics on Business Intelligence
Stats show why business intelligence exercises matter. The global BI market hits $55.48 billion by 2026, growing at 10.1% yearly. Over 94% of firms say BI is critical for success. Data-driven companies are 19 times more profitable. In 2025, 72% of businesses use AI in BI for better insights. Adoption rose 50% in worker access to AI tools. These numbers prove practicing BI pays off big.
Popular Tools for Business Intelligence Exercises
Pick the right tools to make business intelligence exercises effective. Popular ones include:
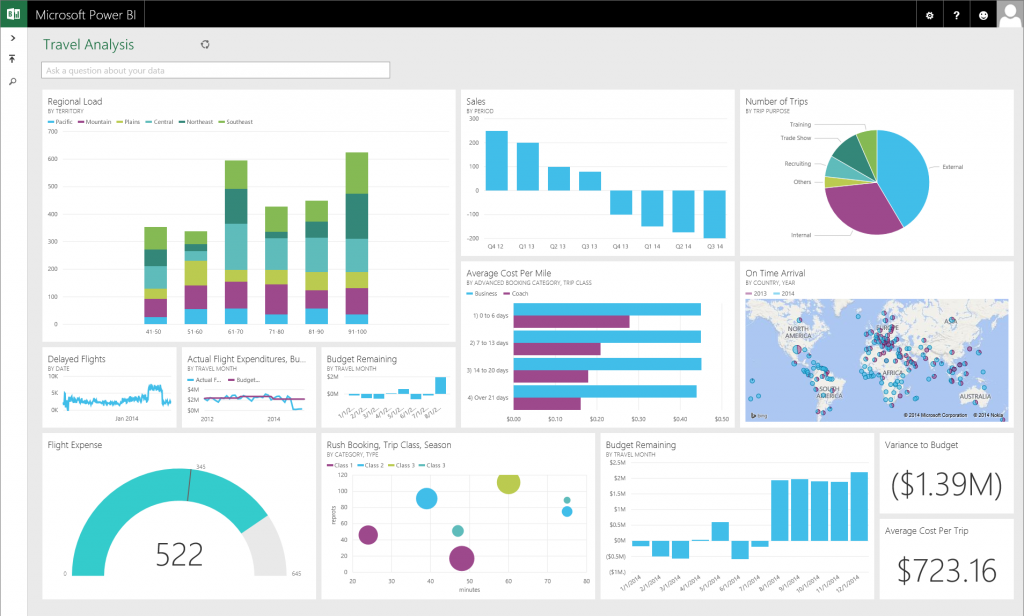
- Microsoft Power BI: Great for visuals and dashboards. Free version available for starters.
- Tableau: Focuses on interactive charts. Easy drag-and-drop interface.
- Excel: Basic but powerful for data cleaning and simple analysis.
- SQL Databases: Like MySQL for querying large datasets.
- Google Data Studio: Free tool for reports, connects to many sources.
- Qlik Sense: Self-service BI with AI features.
- Domo: Cloud-based for real-time data.
- Looker: Good for governed metrics and custom models.
Start with free tools like Excel or Power BI. They handle most beginner exercises well.
Beginner Business Intelligence Exercises
Jump into beginner business intelligence exercises to build basics. These focus on simple data handling. Use free datasets from sites like Kaggle.
Exercise 1: Create a Basic KPI Dashboard Track key metrics like sales or visits.
- Step 1: Download a sales dataset in CSV format.
- Step 2: Import into Excel or Power BI.
- Step 3: Calculate totals using SUM function.
- Step 4: Build bar charts for monthly trends.
- Step 5: Add filters for regions. This data visualization exercise shows performance at a glance. It helps spot low months quickly.
Exercise 2: Sales Funnel Analysis See how leads turn into sales.
- Step 1: Gather data on leads, contacts, and deals.
- Step 2: Use COUNT to tally each stage.
- Step 3: Calculate conversion rates with division formulas.
- Step 4: Visualize as a funnel chart in Tableau.
- Step 5: Identify drop-off points. Practice this business analytics drill to improve customer journeys. Retailers use it to optimize staffing.
Exercise 3: Data Cleaning Challenge Fix messy data for accuracy.
- Step 1: Open a dataset with duplicates and errors.
- Step 2: Remove duplicates using Excel’s tool.
- Step 3: Fill missing values with averages.
- Step 4: Standardize formats like dates.
- Step 5: Export clean file. This data analysis workout ensures reliable insights. Messy data leads to wrong decisions—clean it first.
Exercise 4: Customer Segmentation Group customers by traits.
- Step 1: Load customer data with age and spend.
- Step 2: Use clustering in Power BI.
- Step 3: Create pie charts for groups.
- Step 4: Analyze spend per segment.
- Step 5: Suggest targeted offers. Bold this as a BI practice drill. It personalizes marketing, boosting sales by 20% in tests.
Exercise 5: Monthly Revenue Trend Track income over time.
- Step 1: Import revenue data.
- Step 2: Plot line chart in Google Data Studio.
- Step 3: Add annotations for events like campaigns.
- Step 4: Forecast next month using trends.
- Step 5: Share report. This exercise builds forecasting skills. Firms see 40% better planning with trends.
Intermediate Business Intelligence Exercises
Move to intermediate business intelligence exercises for deeper analysis. These add complexity like joins and predictions.
Exercise 1: Year-Over-Year Performance Analysis Compare yearly data.
- Step 1: Merge two years’ datasets.
- Step 2: Calculate growth percentages.
- Step 3: Use bar charts to show changes.
- Step 4: Highlight top performers.
- Step 5: Report insights. This data visualization task reveals growth patterns. Use it to plan budgets.
Exercise 2: SQL Query for Sales Trends Pull data with queries.
- Step 1: Connect to a SQL database.
- Step 2: Write SELECT with GROUP BY for months.
- Step 3: JOIN tables for products.
- Step 4: ORDER BY sales descending.
- Step 5: Export results. SQL queries are key in BI. Practice boosts query speed by 50%.
Exercise 3: Inventory Optimization Manage stock levels.
- Step 1: Load sales and stock data.
- Step 2: Calculate turnover rates.
- Step 3: Use scatter plots for demand vs. stock.
- Step 4: Predict shortages.
- Step 5: Recommend orders. This business analytics drill cuts costs. Retailers reduce waste by 30%.
Exercise 4: Scenario Simulation Test what-if situations.
- Step 1: Build a model in Excel.
- Step 2: Change variables like price.
- Step 3: See impact on revenue.
- Step 4: Use sliders for easy tests.
- Step 5: Choose best scenario. Simulations aid planning. Firms avoid risks better.
Exercise 5: Churn Analysis Predict customer loss.
- Step 1: Gather usage data.
- Step 2: Identify churn indicators.
- Step 3: Build a simple model in Power BI.
- Step 4: Visualize risk groups.
- Step 5: Suggest retention tactics. This BI tools exercise keeps customers. SaaS firms cut churn by 15%.

Advanced Business Intelligence Exercises
Tackle advanced business intelligence exercises for pro-level skills. These involve AI and big data.
Exercise 1: Predictive Analytics with Machine Learning Forecast future sales.
- Step 1: Use Python or Power BI AI visuals.
- Step 2: Train on historical data.
- Step 3: Test accuracy.
- Step 4: Visualize predictions.
- Step 5: Adjust for seasons. Predictive analytics drives growth. 53% of firms enhance decisions with it.
Exercise 2: ETL Process Building Extract, transform, load data.
- Step 1: Pull from multiple sources.
- Step 2: Transform with scripts.
- Step 3: Load to dashboard.
- Step 4: Automate schedule.
- Step 5: Monitor errors. ETL is core to BI. Automate to save 40% time.
Exercise 3: Custom Dashboard with Embedded Analytics Build interactive reports.
- Step 1: Use Looker or Tableau.
- Step 2: Embed in a web app.
- Step 3: Add user filters.
- Step 4: Test on mobile.
- Step 5: Share securely. This data analysis workout engages teams.
Exercise 4: Fraud Detection Simulation Spot anomalies.
- Step 1: Load transaction data.
- Step 2: Use stats for outliers.
- Step 3: Build alerts in Qlik.
- Step 4: Investigate flags.
- Step 5: Report findings. Finance sectors benefit most. Reduces losses by 40%.
Exercise 5: Big Data Integration Handle large volumes.
- Step 1: Use tools like Databricks.
- Step 2: Query with Spark SQL.
- Step 3: Visualize trends.
- Step 4: Scale for more data.
- Step 5: Optimize queries. Big data exercises prepare for enterprise work.
Tips for Success in Business Intelligence Exercises
Follow these to excel:
- Start small—build confidence.
- Use real datasets for relevance.
- Track your progress with journals.
- Join communities like Reddit’s r/BusinessIntelligence.
- Practice daily for 30 minutes. For resources, check Business to Mark for business tips. If data errors arise, see this windows error generator guide.
Frequently Asked Questions (FAQs)
What are business intelligence exercises? They are practice tasks to build BI skills, like dashboards and queries.
Why should I do business intelligence exercises? They improve decisions and efficiency. Stats show data-driven firms thrive.
What tools do I need for beginner business intelligence exercises? Start with Excel or free Power BI.
How long to master business intelligence exercises? Beginners see gains in weeks with regular practice.
Can business intelligence exercises help my career? Yes—BI skills boost employability. 72% of firms adopt BI by 2026.
Conclusion
Business intelligence exercises transform how you handle data. From beginner dashboards to advanced predictions, they offer actionable ways to grow. Practice builds expertise and drives business success. Remember, data-driven firms lead the pack. What business intelligence exercise will you try first?
References
- CTND: Practical Business Intelligence Exercises – https://www.ctnd.com/practical-business-intelligence-exercises
- Domo: 17 Real-World Examples – https://www.domo.com/learn/article/business-intelligence-examples
- Metana: 30 Top BI Exercises – https://metana.io/blog/30-top-business-intelligencebi-exercises-to-build-skills-and-personal-brand
- Scoop: BI Statistics – https://scoop.market.us/business-intelligence-statistics
- Deloitte: State of AI 2026 – https://www.deloitte.com/us/en/what-we-do/capabilities/applied-artificial-intelligence/content/state-of-ai-in-the-enterprise.html
Comments are closed.