Quick Summary: Order Flow Trading
Order flow trading is a method of analysing how buyers and sellers interact in real time. Instead of relying only on historical price candles, traders study liquidity, executed volume, bid and ask activity, market depth and changes in the order book.
For intraday traders, this can provide extra context around:
- Where significant liquidity is resting.
- Whether buyers or sellers are becoming more aggressive.
- Absorption around important price levels.
- Volume exhaustion and failed continuation.
- Potential stop runs and liquidity sweeps.
- Changes in market depth before and during price moves.
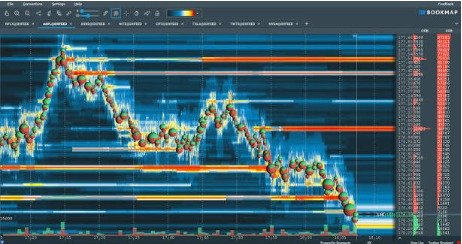
Bookmap is a leading order flow trading platform built around real-time liquidity visualisation. Its heatmap displays historical and current order-book liquidity alongside traded volume, helping traders interpret market activity without relying solely on traditional charts.
 Also readHow a Margaret River Wine Estate Built a Brand Around Conservation
Order flow does not predict markets or guarantee profitable trades. Its value lies in showing what market participants are doing right now.
What Is Order Flow Trading?
Order flow trading studies the interaction between incoming market orders and resting limit orders.
A standard candlestick tells you where price opened, closed, and traded high and low. Order flow analysis goes further by showing bid/ask volume, depth, liquidity and transaction activity.
This makes order flow especially useful for futures, equities and cryptocurrency traders working on short time frames.
Level 2 Market Depth Trading Techniques
Level 2, or market-depth analysis, looks at the orders sitting above and below the current price.
Traders may look for:
- Large concentrations of resting liquidity.
- Orders being added or cancelled.
- Repeated reactions around high-liquidity zones.
- Changes in depth as price approaches a key level.
Depth should never be read in isolation. Resting orders can be cancelled, moved or replaced, so experienced traders usually combine depth with executed volume and price behaviour.
Bookmap’s heatmap turns these changes in liquidity into a visual history, so traders can see where liquidity appeared, disappeared or held its ground.
Footprint Chart Analysis for Day Traders
Footprint charts break down trading activity inside each price bar and usually show how much volume traded at the bid and the ask.
They can help traders investigate:
- Buy-versus-sell aggression.
- Imbalances at individual price levels.
- High-volume areas.
- Absorption.
- Delta changes.
Bookmap supports footprint-style analysis alongside its heatmap and other order flow views, giving traders several ways to study the same market interaction.
Tape Reading Strategies for Futures Markets
Tape reading focuses on transactions as they happen.
Futures traders watch the speed, size and direction of executions to judge whether aggressive participants are entering the market.
Modern markets produce far more data than anyone can read manually. Visual tools solve this by turning time-and-sales data into bubbles, volume profiles and other graphics.
Bid/Ask Volume Profiling Methods
Bid/ask volume profiling compares transactions executed against buyers and sellers at different price levels.
A trader might use it to identify:
- Areas where aggressive buying was concentrated.
- Areas where aggressive selling dominated.
- High-volume acceptance zones.
- Low-volume rejection zones.
- Gaps between price direction and volume delta.
Volume profiling works best when read alongside market structure, not as a standalone signal.
DOM Order Book Scalping Strategies
The Depth of Market, or DOM, shows resting bids and offers around the current price.
Scalpers often use the DOM to judge short-term liquidity, execution activity and shifts in order-book imbalance.
The challenge is speed. In highly liquid markets such as E-mini futures, orders change extremely quickly. Bookmap offers a visual alternative, letting traders see depth across price and time instead of watching only a fast-moving ladder.
Understanding the Bigger Market Context
Market Microstructure and Price Discovery
Market microstructure looks at how orders, exchanges, liquidity providers and participants interact to form prices.
Price discovery happens continuously as buyers and sellers submit, cancel and execute orders.
Order flow trading is essentially market microstructure put into practice. Traders read this auction process to understand why price may speed up, stall or reverse around certain liquidity zones.
Big macro events also shape this process. Inflation data and central bank decisions can suddenly change liquidity and volatility, which is why many traders track releases like the latest inflation jump and what it means before the Fed’s next decision.
Advanced Technical Analysis for Intraday Traders
Advanced intraday analysis often combines order flow with established tools such as:
- Support and resistance.
- VWAP.
- Volume profiles.
- Volatility.
- Trend structure.
- Session highs and lows.
- Previous-day reference levels.
Order flow does not have to replace technical analysis. It adds a closer view of what is happening when price reaches a technically important level.
Execution Algorithms and Smart Order Routing
Institutional participants often use algorithms to split, route and execute large orders.
Smart order routing can search multiple venues or liquidity sources to meet set execution goals.
For discretionary traders, it is worth remembering that much market activity is algorithmic. A burst of small trades, for example, does not automatically mean lots of independent traders are acting at once. Automation and AI are changing decision-making well beyond trading too, as covered in our look at how artificial intelligence is reshaping e-commerce.
Institutional Liquidity in Modern Markets
Large participants need far more liquidity than retail traders.
This creates an execution problem: entering or exiting a big position too aggressively can move the market against them.
Institutional activity may therefore involve sliced orders, passive execution, iceberg orders and other techniques designed to reduce market impact.
Bookmap helps traders observe liquidity behaviour and executed volume without claiming to know the intentions of every participant.
How Proprietary Trading Firms Work
Proprietary trading methods vary widely between firms.
Professional traders often combine market microstructure, execution quality, statistical research, risk controls and order flow rather than depending on a single indicator.
Retail traders can follow the same principle: use order flow as part of a defined process with risk management, testing and clear rules, not as a hunt for a guaranteed entry signal.
Practical Order Flow Trading Setups
Detecting Hidden Iceberg Orders on CME Globex
An iceberg order shows only part of its total size while the rest stays hidden.
One clue is repeated execution at a price where the visible quantity looks too small to explain the total volume traded.
Detecting icebergs reliably needs the right exchange data and method. Bookmap offers Stops & Icebergs tools for compatible CME data sources, including BookmapData and supported Rithmic MBO setups.
E-mini S&P 500 CVD Divergence Setup
Cumulative Volume Delta (CVD) tracks the difference between aggressive buying and aggressive selling over time.
A commonly studied divergence looks like this:
- ES makes a new price high or low.
- CVD fails to confirm the move.
- Liquidity or executed volume suggests weakening participation.
- The trader waits for more confirmation instead of assuming divergence means a reversal.
CVD divergence is context, not a guaranteed trading signal.
How to Trade Absorption and Volume Exhaustion
Absorption happens when heavy aggressive buying or selling meets enough passive liquidity to stop price from moving much further.
Volume exhaustion describes moments when aggressive participation fades as a move develops.
Useful questions to ask:
- Is heavy volume trading without real price progress?
- Does liquidity keep refreshing at the same level?
- Is aggressive volume rising or fading?
- Does price then accept or reject the area?
Bookmap makes this easier to study by showing liquidity and executed volume together.
Case Study: Trading CME Liquidity Sweeps
Picture a hypothetical ES market approaching the previous session’s low.
Sell orders suddenly accelerate through the level, triggering more transactions. But instead of falling further, price hits heavy liquidity and quickly climbs back above the previous low.
An order flow trader might study:
- The liquidity visible before the sweep.
- Transaction volume during the break.
- Whether sell aggression continued afterwards.
- CVD behaviour.
- Whether buyers reclaimed the level.
This is analysis, not an automatic signal to enter a trade. The same pattern can play out differently depending on market conditions.
Order Book Imbalance Scalping in Crypto
Crypto markets provide continuous order-book data across many exchanges.
Order-book imbalance strategies compare available bid and ask liquidity and may combine it with executions, spread, volatility and short-term price action.
Because crypto liquidity is spread across exchanges, the venue and data source you analyse really matter. Bookmap supports real-time connections to many crypto markets, including Binance and Bitfinex.
Order Flow Trading Software and Data
Best Order Flow Trading Software in 2026: Pricing Compared
The right order flow software depends on your market, data needs and preferred workflow.
Bookmap’s current core plans are Digital Free, Digital Plus, Global and Global Plus. At the time of writing (October 2026), Bookmap’s UK pricing starts at £16 per month for Digital Plus, £42 per month for Global and £84 per month for Global Plus, with lower effective monthly rates on annual billing. Market data is usually bought separately.
Global and Global Plus mainly suit traders who need full-depth futures or equities connectivity, while Digital Plus can suit crypto-focused users.
Independent Trustpilot reviews are another useful reference. Bookmap has hundreds of reviews there. Positive feedback often mentions its market visualisation and support, while some reviewers raise concerns about pricing, add-on costs and the learning curve.
That balance of feedback is worth weighing before choosing any professional trading platform.
Sierra Chart vs Bookmap for Footprint Analysis
Sierra Chart and Bookmap can both be part of an advanced order flow workflow, but they focus on different things.
Sierra Chart is well known among futures traders for highly configurable charts, Numbers Bars and deep customisation.
Bookmap puts more emphasis on showing historical order-book liquidity as a heatmap, combined with transaction bubbles, depth, volume tools and compatible order flow add-ons.
If your main goal is classic footprint configuration, Sierra Chart may fit neatly into a chart-based workflow. If you want to watch liquidity build and shift around price, Bookmap’s visual approach may suit you better.
The right choice depends on your workflow, instruments, data feeds and execution needs, not on a universal winner.
Free Cumulative Delta Indicators for TradingView
TradingView users can find community and third-party cumulative delta tools, but they work differently because not every data source classifies trades the same way.
Before using a free CVD indicator, check:
- How buy and sell volume is calculated.
- Whether the data reflects real bid/ask executions or an estimate.
- Which exchange or venue supplies the data.
- Whether historical and real-time calculations match.
For deeper order flow analysis, full-depth data through a dedicated platform such as Bookmap gives far more context than a single delta indicator.
Order Flow Data Feed Costs in the UK
UK traders accessing US futures usually face two separate costs: platform access and exchange/data fees.
Bookmap’s own CME market-data offering currently lists individual CME Group exchanges at $34 per month for non-professional traders, with a CME/CBOT/NYMEX/COMEX bundle at $79 per month. Professional pricing is different.
Bookmap also supports third-party connectivity, including Rithmic and dxFeed, and its documentation lists CQG among supported futures connections.
Always check the full cost of platform, broker and exchange subscriptions before signing up.
Jigsaw Trading DOM Setup for Beginners
Jigsaw Trading is closely linked with ladder-based DOM trading.
Beginners comparing a standard DOM with Bookmap should think about how they process information best.
A ladder focuses on numerical depth around the current price. Bookmap turns depth into a visual heatmap and keeps its history on the chart.
Some traders prefer numbers; others find visual liquidity easier to read. Testing both in simulation can show which interface supports a more disciplined process.
Why Choose Bookmap
Bookmap has become one of the leading platforms for traders who want to see liquidity rather than rely only on candles.
Its approach offers several practical advantages:
- Visual liquidity analysis: The heatmap shows where liquidity has existed and how it changes as price moves.
- Executed-volume context: Volume bubbles highlight where significant transactions take place.
- Full-depth connectivity: Bookmap supports multiple market-data providers for futures, stocks and crypto.
- Advanced order flow tools: Compatible features include footprint analysis, DOM tools and specialised liquidity indicators.
- Replay and education: Traders can replay past sessions and practise reading order flow without using live markets as their only classroom.
- Flexible access: Different subscription levels let traders pick features based on asset class and experience.
Bookmap says it connects with more than 25 data/OMS platforms and crypto exchanges and is built for both professional and retail traders.
For traders who want to understand how liquidity moves around price, Bookmap offers a distinctive alternative to static Level 2 screens and chart-only analysis.
Get started with Bookmap to explore real-time order flow, or speak to an expert before choosing a data connection and subscription.
Choosing the Right Order Flow Setup
Software or Strategy: What Do You Need?
Software and strategy solve different problems.
Choose specialised software when you need better visibility into liquidity, depth or executed volume. Choose education when your main challenge is reading that information consistently.
Many traders need both.
Match the Tool to Your Asset Class
Your market decides your data needs.
Index futures traders may need CME depth data. Equity traders need suitable stock-market feeds. Crypto traders need connections to the right exchange.
Bookmap supports all three, although features and data arrangements vary.
Automated Indicators or Discretionary Scalping?
Automated indicators can summarise specific conditions, while discretionary analysis lets traders weigh context as it develops.
Neither removes uncertainty. Decide whether you want software to flag events or prefer to read raw liquidity and volume yourself.
Beginner Education or Institutional-Grade Tools?
Beginners usually benefit from learning market structure before adding lots of indicators.
More experienced traders may need deeper historical data, MBO feeds, execution tools or specialised add-ons.
Bookmap offers different subscription tiers so traders can add features as their needs grow.
Which Data Feed Do You Need: Rithmic, CQG or Direct?
Data connectivity affects depth, latency and the information available to order flow tools.
Bookmap supports integrations including Rithmic, CQG and dxFeed, depending on the broker, market and setup.
Check compatibility before buying a platform or data feed.
Key Order Flow Concepts Explained
Order Flow Trading
Order flow trading analyses current buying, selling, executed volume and available liquidity to understand short-term market behaviour.
Continuous Auction Liquidity Tracking
Financial markets run as continuous auctions where buyers and sellers compete for execution. Liquidity tracking looks at how available orders change during that process.
Real-Time Order Book Depth Analysis
Real-time depth analysis studies bids and offers beyond the best available price to see where liquidity is concentrated.
Volume Delta and Tape Reading
Volume delta compares aggressive buying and selling, while tape reading looks at individual or grouped transactions as they happen.
Intraday Market Microstructure Trading
Intraday market microstructure trading applies knowledge of liquidity, execution and order-book behaviour to short-term trading decisions.
Frequently Asked Questions
Is order flow trading suitable for beginners?
Yes, but beginners should first learn basic market structure, order types and risk management. Simulation and replay help traders see how liquidity behaves before risking real money.
Does order flow trading predict price movements?
No. Order flow shows current and recent market activity. It improves context, but it cannot reliably predict future prices.
Can Bookmap detect iceberg orders?
Bookmap offers specialised Stops & Icebergs features for compatible CME data sources. Availability depends on the market, data feed and subscription.
Is Bookmap available to UK traders?
Yes. Bookmap offers GBP pricing and can be used by UK traders, subject to the requirements of their broker, exchange and market-data provider.
How much does Bookmap cost?
Current UK monthly pricing lists Digital Plus at £16, Global at £42 and Global Plus at £84. Data subscriptions and some extra tools cost more, so check the full setup before buying.
Is Bookmap better than a traditional DOM?
They show information differently. A traditional DOM gives a numerical ladder, while Bookmap shows liquidity across both price and time. Traders who struggle with fast-changing DOM numbers may prefer Bookmap’s heatmap.
Do Trustpilot reviews recommend Bookmap?
Trustpilot shows hundreds of Bookmap reviews. Many praise its visualisation, education or support, while some criticise the cost, add-ons or interface. Weigh both sides rather than relying on single testimonials.
How do I get started with order flow trading?
Start by picking the market you want to trade, getting suitable depth data and learning how liquidity, aggressive volume and order execution interact.
With Bookmap, traders can combine live depth, liquidity heatmaps and executed-volume visuals in one place.
Get started with Bookmap, book a consultation or speak to an expert to find the subscription and data setup that best fits your market and trading workflow.
For more practical guides on markets, money and growth, browse our latest business articles.
Trading involves substantial risk and is not suitable for everyone. Order flow analysis tools provide market information, not guaranteed predictions or investment advice.